Medical Decision Making
Lecture notes: Week 4
Review: Likelihood Ratios
The likelihood ratio for a positive test (written LR+), if you remember from last week, is a ratio of the true positive rate to the false positive rate. That is, LR+ = TPR/FPR = sensitivity/(1-specificity). A likelihood ratio of 1 means that there are just as many true positives and false positives, so a positive result on the test gives no useful information. Likelihood ratios higher than 1 mean that a positive test result suggests that the condition is present; likelihood ratios less than 1 mean that a positive test result suggests that the condition is absent. Likelihood ratios can go as low as 0 (if the test is positive, the condition is definitely absent), and as high as you like (an infinite likelihood ratio means that if the test is positive, the condition is definitely present).
We can similarly define the likelihood ratio for a negative test, as the ratio of true negatives to false negatives. LR- = TNR/FNR = specificity/(1-sensitivity). This tells us how much information a negative test gives us about the absence of a condition. Note that LR+ and LR- are different; a good test can be high in both, a bad test low in both, and many tests are higher in one than the other. In particular, a sensitive but not specific test will have a high LR- and a low LR+, following the SNOUT principle -- a negative result on a sensitive test is highly informative. Similarly, a specific but not sensitive test will have a high LR+ and a low LR-, following the SPIN principle -- a positive result on a specific test is highly informative.
An Application: Iliad
Iliad is a medical decision aid software program. It is built around a Bayesian calculator; given information about symptoms and relevant findings, it computes the posterior probabilities of various conditions. It does this by combining prior probabilities with likelihood ratios associated with the findings you enter. Because it knows which findings have the highest likelihood ratios, it can also ask for those findings first and generally suggest a good order for doing tests. Although few doctors use Iliad in their practice, some medical schools use it to help teach students some of these concepts.
The Problem of Multiple Tests
A convenience of likelihood ratios and the odds formulation of Bayes theorem is that you can do things like this:
Posterior Odds = Prior Odds * LR for finding 1 * LR for finding 2 * ...
But this only works when the likelihood ratios are conditionally independent. This means that the likelihood ratio for a finding should not depend on the likelihood ratio for another finding.
When might things not be conditionally independent? Consider that people who tend to be false positives on a single ELIZA blood test for HIV are probably more likely to be false positives on a second ELIZA. This means that positive results on two ELIZAs is not going to increase the posterior probability as much as positive results on two independent tests. In fact, if ELIZA is perfectly reliable, in the sense that someone who gets a false positive always gets a false positive, then the second "confirmatory" ELIZA doesn't increase our confidence at all.
Unfortunately, we often know much less about whether tests are conditionally independent than we'd like to. When we have multiple tests available and suspect they're not independent, we usually resort to something other than Bayesian analysis. We'll discuss what that "something" is when we discuss clinical prediction rules later in the course.
ROC Curves
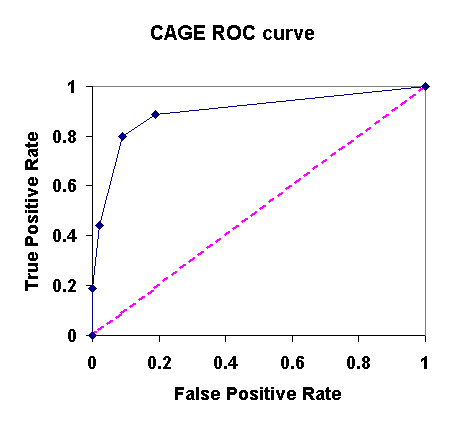
An ROC (receiver operating characteristic) curve is a way of describing the behavior of a test more completely. Recall that it's often possible to choose a different criterion for a test (a different number of white blood cells, a different number of answers to the CAGE inventory, etc.) and that when you do so, you increase the number of false positives in order to decrease the number of false negatives, or vice versa.
For a given test, a ROC curve plots the proportion of false positives against the proportion of true positives (aka 1-FN) at each level of the criterion that one could choose. For example, consider the CAGE inventory, in which we can choose to call someone an alcoholic if they answer yes to 1, 2, 3, or 4 questions. Here's what the false positive and true positive rates would look like in a table, for each criterion:
|
CAGE criterion |
False Positive |
True Positive |
|
4 |
0.00 |
0.19 |
|
3 |
0.02 |
0.44 |
|
2 |
0.09 |
0.73 |
|
1 |
0.19 |
0.89 |
Plotting these data yield the ROC curve:

The more the ROC curve bows toward the upper left corner, the better the test. It's beyond the scope of this course, but the amount of area beneath the ROC curve turns out to be a very good measure of the overall discriminability of the test.